RouteRx (Careline) — Bi-Directional Transit Hub
- Role
- Lead Data Scientist & Spatial Systems Engineer
- Dates
- 2026
- Stack
- RStudio · Python · Tigercensus · OpenStreetMap · GTFS · OSRM · React
01.Executive Summary
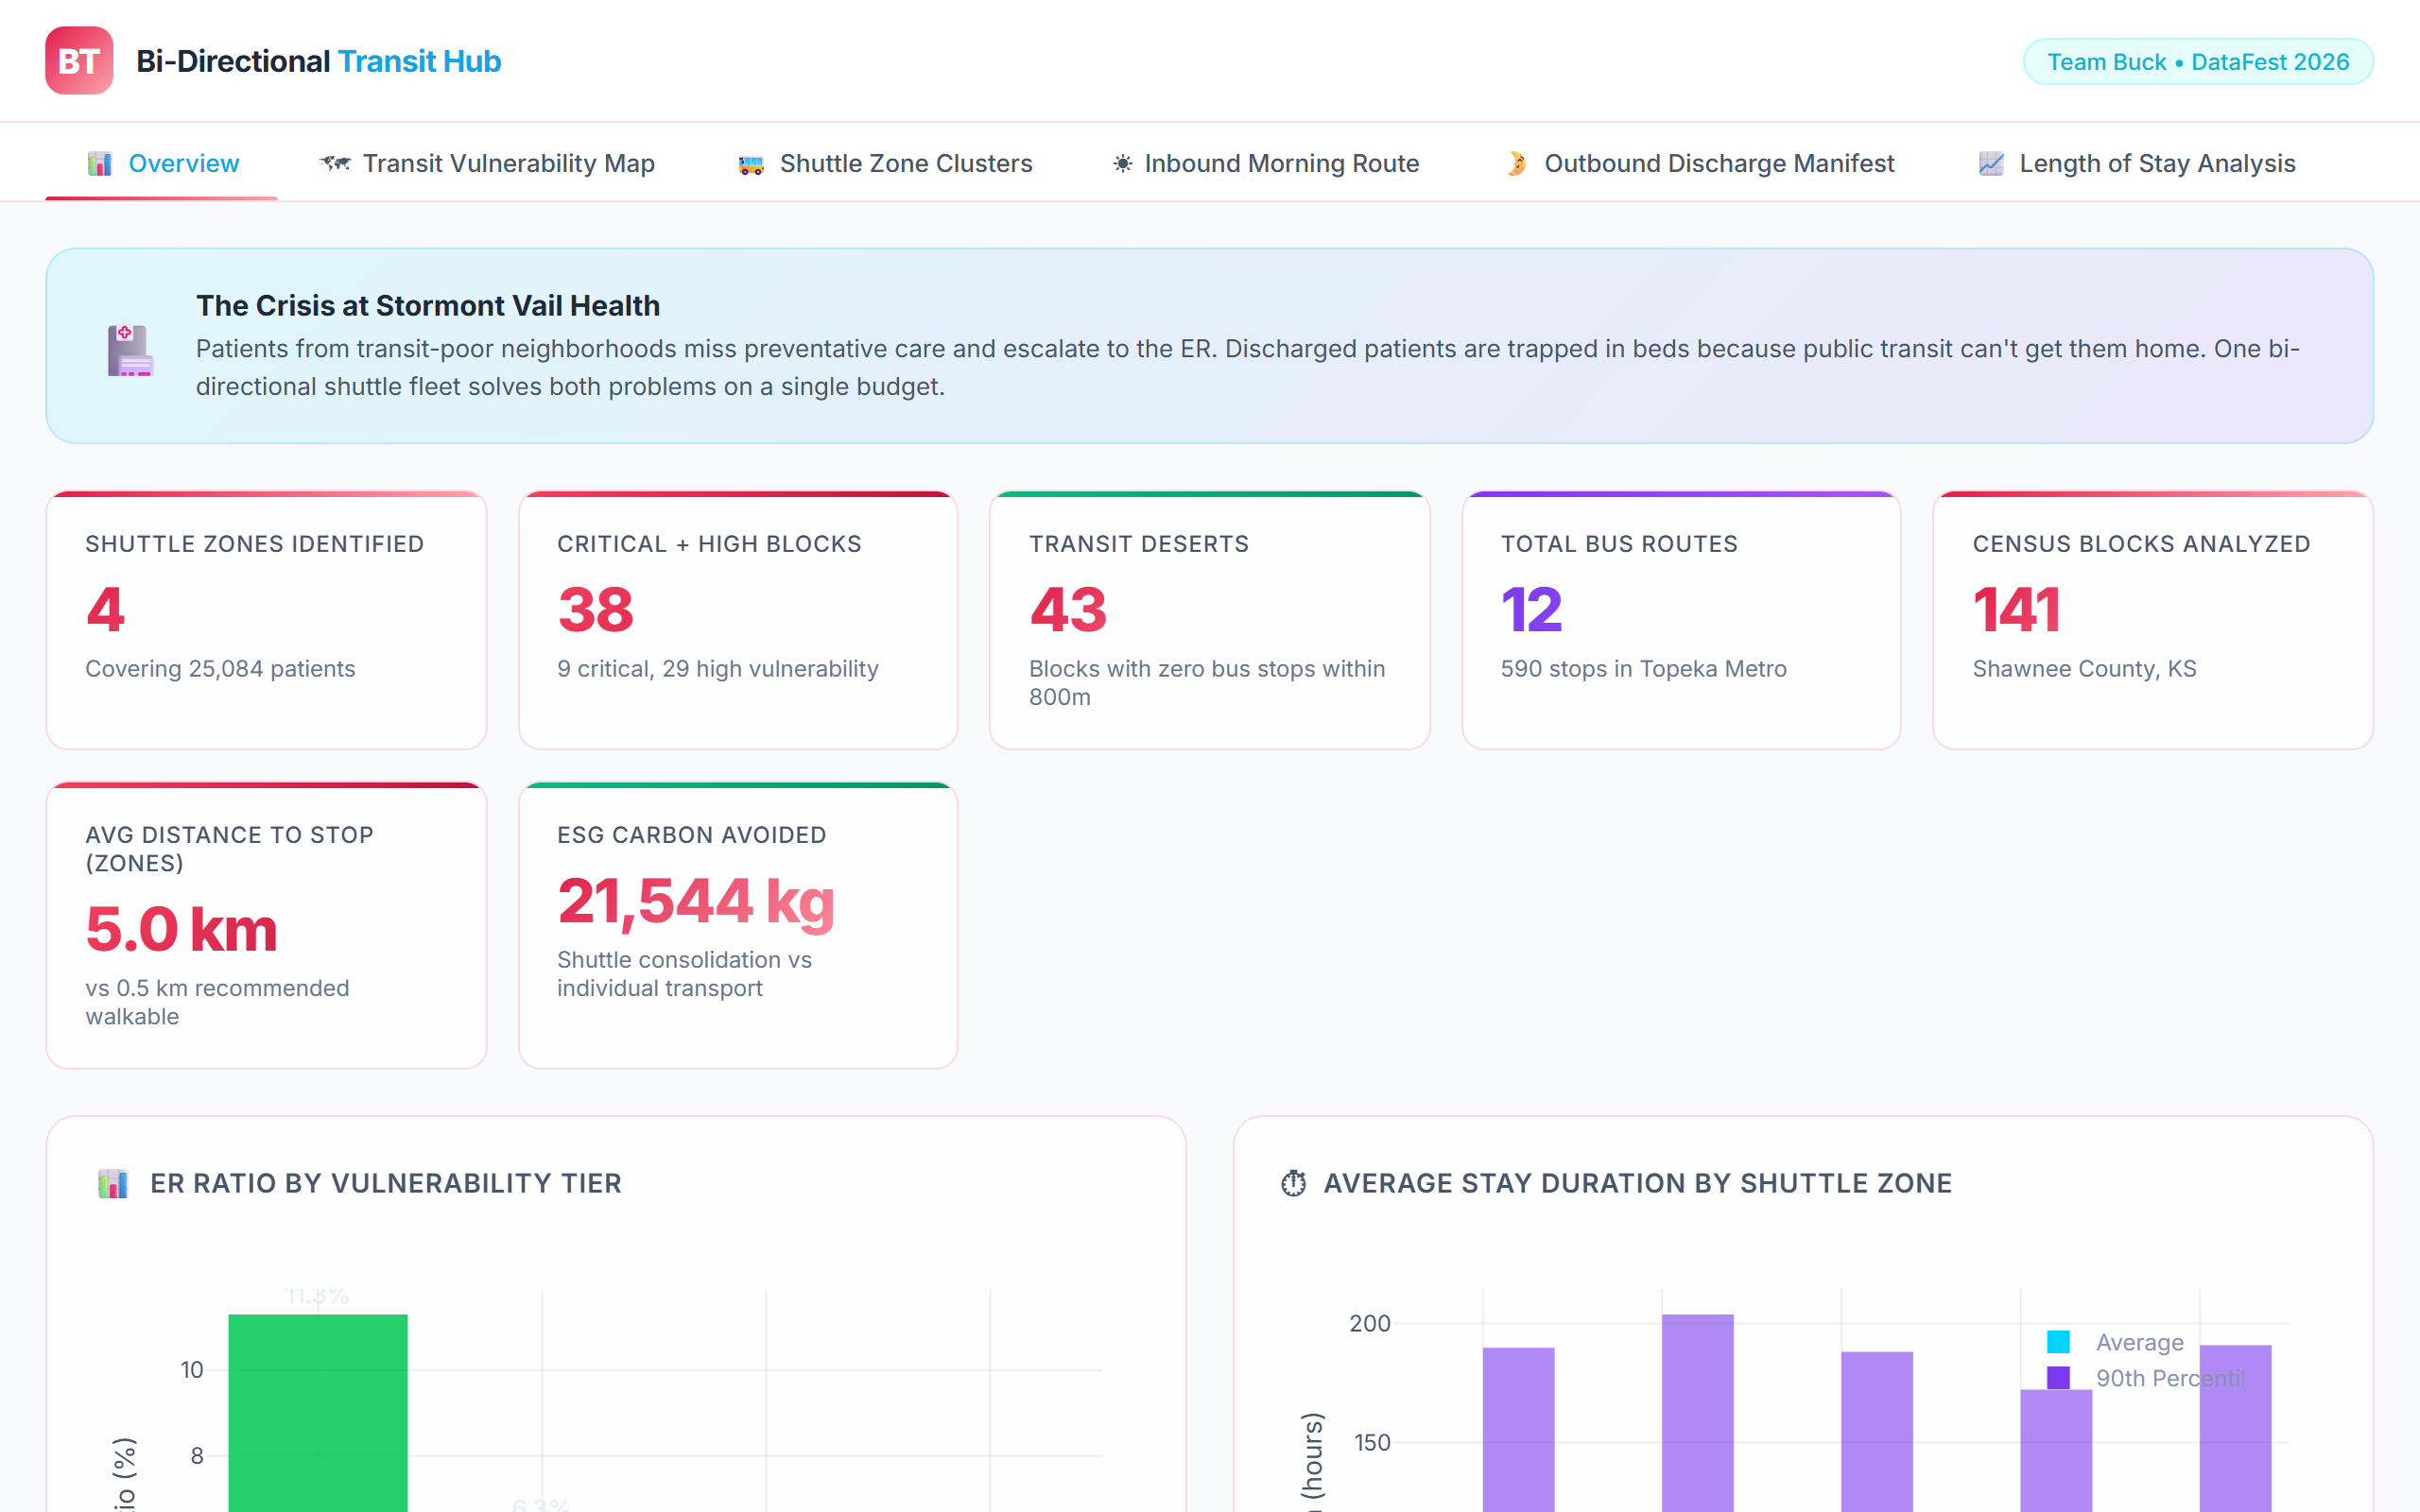
RouteRx (Careline) is a spatial logistics engine designed for Stormont Vail Health in Topeka, KS. By unifying preventative patient pick-up routes with discharge return trips on a single bi-directional shuttle fleet, it eliminates healthcare transit deserts while clearing acute hospital bed bottlenecks.
02.Problem & Constraints
Patients in transit-isolated census blocks miss preventative appointments and escalate into preventable ER emergencies. Simultaneously, medically discharged inpatients are trapped occupying acute hospital beds because public transit stops are inaccessible. In Topeka, 43 of 141 census blocks had zero bus stops within an 800m walking radius.
03.System Architecture
Engineered a spatial analytics workflow combining Tigercensus demographic data, OpenStreetMap road networks, and GTFS transit schedules in RStudio and Python. Formulated a Transit Vulnerability Index (TVI) and applied DBSCAN density clustering to identify patient pickup zones, routing shuttles through Open Source Routing Machine (OSRM) turn-by-turn geometry.
RouteRx (Careline) Spatial Data Pipeline (C4 Model)
Multi-source geospatial data fusion pipeline driving bi-directional routing manifests.
External Geodata
Pulls census demographics, bus stop coordinates, and road network edges
TVI Calculator
Calculates Transit Vulnerability Index for all 141 Shawnee County blocks
DBSCAN Spatial Clusterer
Groups high-vulnerability residential blocks into optimal pickup nodes
OSRM Routing Machine
Generates turn-by-turn driving paths and arrival ETA manifests
Hospital Dispatch UI
Visualizes transit deserts and generates daily driver passenger manifests
Inter-Component Protocol Boundaries
04.Engineering Decisions & Tradeoffs
Aggregated million-coordinate spatial geometries into regional bounding boxes and discrete shuttle stop clusters, trading micro-level coordinate fidelity for real-time routing calculation speeds.
Decision 1: Bi-Directional Fleet Utilization vs Separate Fleets
Unified shuttle manifest pairing morning preventative pickups with afternoon discharge returns.
Commissioning two dedicated independent shuttle fleets.
More complex routing optimization and dynamic manifest rescheduling.
Cut simulated transportation costs by ~40% while freeing acute hospital inpatient capacity.
Decision 2: DBSCAN Spatial Clustering vs Fixed Administrative Zones
Density-based spatial clustering of vulnerable patient centroids.
Grouping by standard ZIP code or municipal neighborhood boundaries.
Clusters do not strictly align with existing municipal district boundaries.
Revealed contiguous transit-starved micro-clusters that cross ZIP code boundaries.
05.Evaluation & Verified Metrics
Key performance indicators and latency profiles benchmarked under explicit workload and hardware constraints.
Award
Best Use of External Data (ASA DataFest 2026)
Measured on: The Ohio State University, College of Arts & Sciences.
Transit Deserts
Blocks with 0 bus stops within 800m
Measured on: RStudio, OSRM routing engine, Python spatial libraries.
Routing Engine
Bi-directional patient pickup & discharge routing
Fleet Optimization
Simulated savings from dual-use shuttle fleet
06.Personal Contribution
Co-led spatial modeling with Samay Patel, Harsha Kalivarapu, and Sudhish Gopalakrishnan. Authored the Transit Vulnerability Index formulas, performed GTFS transit accessibility buffer analysis, and structured the React dispatch dashboard.
07.Limitations & Next Steps
Known limitations:
Assumes normal road weather conditions and standard walking capabilities; does not account for temporary winter snow closures or steep topographical barriers.
Next engineering steps:
Integrating real-time vehicle GPS tracking and wheelchair-accessibility constraint filters into the active OSRM dispatcher.